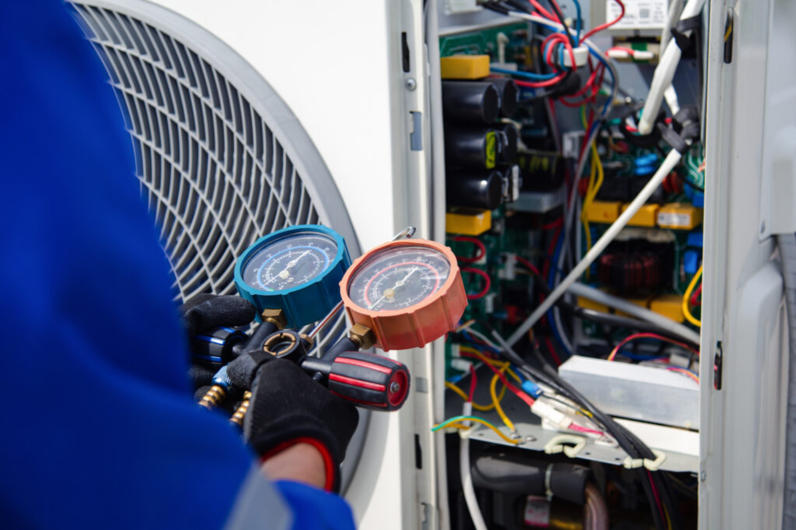
Precise diagnostics in HVAC systems hinge not only on technician experience but also on the accurate use of measurement tools. One such indispensable diagnostic aid is the superheat chart, an instrument that guides technicians in determining whether a refrigeration system is operating within optimal parameters. Often underestimated, the superheat chart serves as a cornerstone in routine system inspections and in-depth troubleshooting. It allows professionals to diagnose refrigerant charges, identify airflow issues, and safeguard critical HVAC components from premature failure.
This blog gets into how HVAC professionals can effectively employ the superheat chart for superior diagnostic performance and why its integration into service protocols is essential in modern HVAC maintenance.
Understanding Superheat and Its Diagnostic Role
Superheat is the temperature of the refrigerant vapour above its boiling point at a given pressure. It indicates how much sensible heat the refrigerant has gained after evaporation. Calculating superheat is pivotal because it reveals how efficiently the evaporator is absorbing heat and whether the compressor is protected from liquid refrigerant returning.
To determine this value accurately, professionals incorporate a superheat chart in conjunction with thermometers and pressure gauges. The chart maps temperature and pressure readings against one another, providing insights into the current operational state of the system.
How to Use the Superheat Chart Effectively?
Effective use of a superheat chart involves the following steps:
1. Measure the suction line temperature close to the evaporator outlet.
2. Record the suction pressure using an appropriate gauge.
3. Convert suction pressure to the saturation temperature of the refrigerant.
4. Subtract the saturation temperature from the measured suction line temperature to find the actual superheat.
Then, using the superheat chart, compare the observed superheat value with the ideal superheat range based on ambient conditions and load. Any deviations suggest potential issues such as overcharging, undercharging, or insufficient airflow over the evaporator coil.
This diagnostic strategy becomes more critical in systems using fixed orifice metering devices, where superheat values serve as the primary performance indicator.
The Superheat Chart in Preventive Maintenance
Incorporating the superheat chart into preventive maintenance protocols allows technicians to detect anomalies before they evolve into costly failures. For example, a low superheat reading may indicate an overcharged system or a faulty metering device, while a high superheat can signal undercharging or airflow restriction.
These signs, when recognised early, reduce stress on the compressor and improve the system's longevity. Moreover, incorporating the superheat method into routine checks ensures compliance with performance benchmarks and industry maintenance standards.
A Diagnostic Tool for Both Technicians and Engineers
The superheat chart is not just an on-field tool but also valuable for HVAC engineers and designers. It plays a crucial role during the commissioning stage of HVAC installations, helping validate that systems are charged correctly and operating under the expected thermal load conditions.
This holds particular relevance in commercial and industrial environments, where maintaining system performance is directly linked to cost savings and operational reliability.
Ensuring System Efficiency through Superheat Control
An optimally charged system not only maintains temperature consistency but also consumes less energy and reduces mechanical strain on components. Through routine deployment of the superheat chart, facilities can ensure that systems function close to their design capacity.
Consider applications in food storage, pharmaceutical manufacturing, or data centre cooling, where temperature control is critical. Here, ensuring correct superheat prevents compressor flooding or overheating, both of which could compromise product quality or result in expensive downtimes.
Integration with Modern Diagnostic Equipment
Today's digital HVAC systems often integrate sensors and intelligent controllers that automatically monitor superheat values. However, even in such settings, technicians must understand how to verify automated readings using a manual superheat chart. This traditional tool serves as a benchmark for assessing the reliability of digital readings, especially in troubleshooting unexpected system behaviour.
Furthermore, training technicians in manual diagnostics builds technical resilience and strengthens service accuracy across varied HVAC models and conditions.
The Chart That Makes Cooling Smarter
Mastering the superheat chart is not merely about reading numbers; it's about transforming data into actionable insights. When used correctly, this chart can streamline diagnostics, prevent equipment failure, and support long-term energy optimisation in HVAC systems.
Yet, to truly extract its value, professionals must combine it with precise instrumentation, consistent methodology, and high-quality electrical equipment. Aligning with a trusted energy brand ensures that every diagnostic activity, no matter how routine, meets the highest standards of accuracy, safety, and performance.


Join the Conversation